Switching to Substack since wordpress has been a nightmare to draft in.
pyrrhusvalue.substack.com
Switching to Substack since wordpress has been a nightmare to draft in.
pyrrhusvalue.substack.com
These are some of my notes to summarize my thoughts in researching Carmax. I’m not going to cover everything but just focus on what I think their competitive advantages are, the online investments, and how I’m thinking about future returns.
Competitive Advantages
Customer Experience
The majority of cars are sold by one and two location dealers with commissioned salespeople, which are consistently poor customer experiences. Carmax started the fixed price, no haggle approach. Their salespeople are not incentivized by getting a higher price, which reduces pressure on the customer. I’ve found myself glossing over this point because I’ve heard it so many times before. Having gone through the process recently, though, I started taking note of all the little things that were adding up. I visited a few used dealerships and sat in a trailer, shoulder to shoulder with another customer, while they looked up if they had another car on Microsoft DOS. It turned out the didn’t, but they subtly tried to convince me that I didn’t actually want the one feature I was looking for. Walking into a Carmax was just a different experience. It was clean facilities. I wasn’t shoulder to shoulder to other customers. Registering was easy. I had the car shipped for $150. It was just better. Car buying isn’t primarily driven by retail experience, but it does play a role in repeat buying, recommendations, and mind share. The fixed, no haggle pricing has been copied by the large competitors but it seems not on the entire package, which you can see in gross margin per unit decreasing while total gross margins (including services, add-ons, financing) have remained flat. It’s too tempting to take margin on the add-ons to fully recreate what Carmax is offering. I don’t think comparing Carmax to the top 10 dealers is the right focus, though. When the largest competitor is 4% of the total market, it matters less that Carmax is a better experience than Lithia or Carvana and more they’re better than Dan’s Used Car Depot. This market reminds me of industrial distribution where the market is massive with a long tail of small players that the largest take share from for decades. Carmax is clearly better against those competitors, and the online investments are widening that advantage. The customer oriented culture that started in-store is being continued in spirit through the omni-channel initiatives.
Selection
A car is one of the biggest purchases a consumer makes. It is a huge percentage of their budgets, they spend 10+ hours researching, and they test drive multiple vehicles before purchasing. People spend a lot of time in their vehicles and want to feel how the back seat feels, how the cars drives, whether it “feels” right. They hadn’t thought about how they feel like an old lady in the minivan, so they’ll go see some SUVs and try on other personalities over the weekend. Used cars are not pure commodities. There are millions of permutations – make, model, condition, color, mileage, accident history, financing availability – for consumers to select. How you weight the different attributes is not always entirely rational economically, which I’ve found from personal experience. My wife is an intelligent person, but she became fixated on having a bench seat versus captain seat for our kids. We finally found one 200 miles away for $1,500 more money and she wanted that one. Add in the financing component and these trade-offs become even squishier. The additional price can be negligible in terms of down and monthly payments. This is a reason the market is driven more by availability than purely price. You can see it in dealer gross margins, which outside of a big downturn are actually more stable than many industries. It’s also a reason this is not a winner take all, or even most, market: It would be impossible to perfectly corner the market in inventory to match consumer preferences.
There are about five Carmax locations within an hour or so drive from where I live. In a world where supply is locally defined, Carmax has some benefit from store density. More subtly, assuming it takes a month or two to find the right car, Carmax having 50% faster inventory turns creates more opportunity to find what you’re looking for. You can view Carmax’s advantage as partly reducing search costs. They have more dealerships that are larger in size, and they’ve been shipping 30% of cars for the last ten years locally. When 80%+ of consumers are researching cars and looking at listings online, aggregators have somewhat diminished this advantage. The fact that Carmax can now list the full national inventory of 30,000 cars, though, is a step change in availability. I asked my wife why she was using Carmax or Carvana versus a google search, and her response was she had so many more options nationally then trying to find something within 100 miles. The national inventory is starting to show in the numbers. Historically Carmax has shipped 30% of cars between stores upon customer request, and that has steadily risen to 38% in 2021.
Unit Economics
Carmax has a cost advantage at the unit level and in absolute scale. Inventory turnover is ~20% faster than publicly traded peers and ~50% faster than all dealers. Selling more cars at each location leads to significant leverage in a business where 70%+ of costs are fixed. They can have much lower compensation, occupancy, and depreciation (faster turnover) for each of the units they sell. They have “production stores” – larger acre sites with multiple reconditioning bays – where the smaller, retail only stores can send cars for reconditioning prior to resale, which leads to more efficient headcount per car sold. A portion of these savings can be reinvested in better pricing as well as advertising where they can spread dollars over a larger base. This allows for investment in national, brand building campaigns that few competitors can justify.
Carmax has other ways of enhancing their economics outside of fixed cost leverage. They have enough volume to justify a standalone wholesale arm. As the vast majority of used car sales are customers swapping into a slightly nicer vehicle, trade-ins are a necessary offering for dealers. They can re-sell those cars at retail (earning a higher margin as it’s cheaper to source from customers) or flip to other dealers in the wholesale market. Most dealers do not have the scale necessary to justify their own wholesale auctions and rely on Manheim or Adessa who control 70%+ of the market. The combination of auction fees, transport costs and depreciation make the trade-in marginally profitable at best. Carmax does enough volume to justify hosting auctions at their production facilities, which turns a cost of doing business into a profit center. Carmax can select the inventory they want to keep for resale and flip the rest at ~20% gross margins, or $900-$1,000 per car. They do not price these to maximize proceeds like the third-party wholesalers but rather to minimize inventory, meaning they will flip most cars the same day versus only 50% for other auctions.
“Most of the public dealers don’t make money on wholesale, or they lose a little bit of money. And in the obvious exception is CarMax, who makes about $1,000 per vehicle. So it seems like there could be an opportunity there . . . We think centralized valuation with an auction system is the Holy Grail to achieve that goal.” Autonation 2016
Financing, like trade-ins, also needs to be arranged. For most dealers this means collecting a flat fee per car from a third party who can finance with their balance sheet. Carmax on the other hand has a captive financing arm that finances ~40% of cars sold, primarily to prime credits. This is funded with non-recourse securitizations, allowing them to earn the spread between the AR and fixed interest. The remaining that don’t meet their criteria are financed by partners falling into either Tier 2 customers — slightly higher credit risks that lenders will pay ~$400 per loan to Carmax – or Tier 3 customers – unable to secure traditional financing and they pay lenders $750 per loan to enable the transaction. ~40% of Carmax’s pre tax profit is coming from financing and is a major reason Carmax’s PBT Margins are consistently 3-4% higher than publicly traded peers. Even the larger public dealers choose to take fees instead of taking it in house, which ultimately comes down to having the appropriate scale as well as the operational experience. Below are a few quotes from Sonic on their Echo Park segment:
“Is there an opportunity finance-wise down the road? Maybe. But we did not build our model — if you look at the CarMax model, a large portion of that model is built on the need for that — for the financing piece of the business. We didn’t build the model that has to be sustained by a bank.”
“We’ve talked about it 20 times . . . we just don’t have the scale at this point to be able to secure ties the way CarMax does in the marketplace, and we think that staying with our captive providers that we have today in banks and people we have as our premium providers for financing and leasing, that’s really what we have at the moment. This might change as we get real scale on the used car side, can we carve that business out and become — have a finance company. But at this point, I’ll be honest with you. I don’t see a lot of traction on that within our Board right now. A lot of the people have had experience in this area. And I think CarMax has done a terrific job in setting that up. And of course, their scale drives that every day.”
“I don’t know that at the moment, that we have the capital available to start a finance company.”
Carmax earns ~4% higher PBT margins and turns inventory 20% faster than public peers. This is not fully apples to apples. These are different business models, different wholesale/retail/new mixes, different car ages, etc. Whatever the nuances of the business, though, directionally Carmax should be earning higher returns on capital. You can look returns with and without the auto receivables. When including AR, ROA/ROIC/RONTA all look similar to competitors. CAF is financed with basically none of their own money, though. If the question is how many dollars of equity and recourse debt does Carmax have to put in to generate EBIT, then excluding the Auto Receivables is a better way to look at returns. ROE would give the misleading impression that returns are similar across competitors (and they are all pretty good). In reality Carmax is generating triple the unlevered returns on capital and levering the business much less than everyone else. Relative to small dealers, returns would be much, much higher.
The industry has a recipe for price competition in large fixed costs, extreme fragmentation, and little differentiation. That’s certainly true right now as people are cutting price to move inventory. The reality is they have a cost advantage and competitors should not be able to undercut them on price consistently. Even if they could, the profit dollars dealers have to work with are actually small relative to the price of the car. Cutting your gross profit per car 10% could be 50% of your profits while only saving the customer a couple hundred bucks on a $20,000 car. Carmax’s advantage is being the lowest cost and can earn returns in excess of the marginal producer. I believe that can persist over time.

Omnichannel
Starting in 2018, Carmax started investing heavily in streamlining the online experience for customers. They’ve taken an incremental approach geographically, testing in specific markets and rolling out nationally afterwards, and with features, slowly building to full self-service online, adding in financing, etc. They’ve spent years and hundreds of millions of dollars building towards enabling a customer to choose their own destiny whether that be partially online though research and reserving to last mile delivery.
Again, this is a heavily researched purchase with well informed buyers spending a huge chunk of their income. The knee-jerk intuition that car buying is not conducive to a fully online transaction is not wrong. Some percentage of customers will want to pick out a car on a website and have it delivered directly to their door. I am highly skeptical that will be the majority of customers. But assume used cars reach the same level of online penetration as all products, roughly 20%. Also assume the Carvana or someone else gets 100% of that market. The used car market is about 40M vehicles annually. Carmax’s addressable market is 0-10 year old vehicles, so call it half of the total. What we’re talking about is taking ~4M used vehicles that Carmax can no longer get in the worst case. There are still millions of cars they continue to take from Ed’s used auto shop. Whether the online investments will have a good ROI is debatable. What they’re not is a response to some existential threat from Carvana. These markets are too large and there are too many entrenched consumer behaviors to be an either/or situation between online and traditional stores.
What seems clear is an increasing portion of the process will move online. In most competitive industries, technology investments should ultimately accrue to the consumer, making all competitors worse off in the process. Why I find Carmax’s investments compelling is the logistics backhaul and absolute dollar investment are very real barriers 90%+ of the industry. The assumption the Carvana requires adequate scale to make the model work is correct. That required them to burn billions of dollars indiscriminately. Unless capital becomes free again to lose money for a decade, the constraint will be who already has enough scale to justify the investments (or who like Echo Park may one day get there). You need enough locations to enable adequate inventory selection, which required decades of capex for Carmax to build a national footprint. You probably need a quasi hub and spoke system with the production centers (or build a pure one like Carvana from scratch). You need to be able to justify an owned fleet to reduce shipping costs and deliver in a timely manner, again requires doing enough volume in the first place. If you’d prefer to pick up and have it quicker, you need the density of locations to make that work. You need to invest in transportation hubs. You need the digital investments and ongoing support, which Carmax has spent hundreds of millions on. You also need to add significant fixed costs in support personnel, technology department, etc. You need enough data to make good offers on cars if you’re trying to re-create instant appraisal, which Carmax has built over decades.
Allowing a customer to screen inventory nationally, become approved online for financing, reserve cars to test drive, and either pick up in-store or have it delivered is a logistics feet that requires scale in the first place. The list of dealers who can pull this off is a short one. Carmax seems well positioned to aggregate eyeballs (more ad spend, Edmunds funnel, better availability), offer capabilities other can’t (last mile, ship nationally, reserving, finance 100% online), and be a better experience overall than most in the industry.
If there are barriers to this investment like I believe, and customers take to it, then the below should start showing up in the results:
Valuation
A major reason I’m interested in the stock at current prices is I don’t believe you have to assume any advantages from their online investments. You can treat them as a used car dealer of five years ago with a bloated cost structure and still do ok. The simplest way to think about the valuation is you’re paying 1.7x book for a company that has historically earned 30% of equity. Thinking in capital terms is necessary as underlying earnings power is dramatically lower today (and will be for several years likely) than the potential. It’s trading at 10x 2019, 8x 2021 and 16x TTM earnings, but none of those really give a complete picture of what is happening in the business. The level of operating expenses they’ve added is disproportionate to what their doing today and what they did in 2019 and will have to be grown into. They’ve added over $800M of G&A since 2019. Some of that is temporary (advertising is elevated to promote omni, some of the “other expenses” are clearly non-recurring) but a lot is true incremental overhead (CECs, technology salaries). Any earnings power has to be viewed several years out, and I don’t think you can realistically have a single EPS figure in five years and have any confidence in it. What I do think you can do is pick the most stable parts of the business and try to bound the problem:
I have a high degree of confidence in the gross profitability not declining. Aggregate used cars are not growing. About ~21M are sold each year and that has been incredibly stable. Even in downturns, used cars have a lot less variability than other cyclical industries. Any growth is going to come from taking share, and Carmax has never had declining market share for more than a year or two in the last twenty years (and likely in the 90s). From 2014-2019, they opened 10-15 stores annually and have grown revenue and used cars about 9% annually. As long as Carmax is opening new stores, market share shouldn’t decline. Carmax gross profit per unit is also incredibly consistent – more so than many businesses I can think of. That’s true for used or including wholesale/CAF/warranties. NIMs can compress, wholesale can become a bigger part of the business, but there’s no reason to believe there will be permanent degradation in gross profitability five years out. There is actually good arguments that this will increase over time, primarily that they are sourcing double the amount of much cheaper cars from customers. Either that or they pass it along to grow share faster. By ignoring both options, this is doubly conservative in those savings just went nowhere.
Management has stated a goal of at least 5% market share by 2025 and 2.2-2.4M total used and WS cars. Let’s say it takes until 2027. Total 0-10 cars sold are consistently around 21M, so that’s ~1M used cars. That’s a 2% CAGR from 2021. That implies 1.1M wholesale units, or a 9% CAGR. Instant appraisal is driving the wholesale growth and is where we’ve actually seen evidence of success (wholesale units doubled between 2019-2021) so I don’t view that as unrealistic. It’s also half the gross profits of a used car. 2.2M total cars by 2027 is conservative. Assume similar gross margins other than normalizing CAF which is overearning. What you end up with is used cars growing 2% CAGR and declining gross margins, so overall gross profits growing 1.8% to $4.6Bn. You can go crazy isolating variables – the broader point is just gross profits aren’t growing fast at all.
Knowing a conservative gross profitability is helpful in bounding outcomes since we just need to focus on overhead. I’ve been frustrated with how little disclosure management has given on how to view true run-rate G&A, but I don’t think they know frankly. Some of this is a moving target based on how well the investments go. G&A has consistently been ~59% of gross profits (including CAF) prior to 2019, up to 75% TTM as they invested heavily in omni, and temporarily over 100% Q3 as demand fell off. Advertising is an easy reduction to save $100M just by getting back to $250/car. Assume workforce can be cut 5% through attrition and other technology can be cut $100M. That’s $250M we’ll call growth spend against the $800M they’ve added, or $2.5Bn of run-rate G&A. Off that, you can play around with what inflation you think is going to be in the fixed costs and what a range of profitability would be.
If they grow gross profits 1.8% and G&A 5%, somehow finding a way to add another $800M of fixed expenses, I still get to $800M of net income or ~6/share in EPS. This implies the profit they make on each car is $500, or 50% below what they did prior to COVID. That’s still a 10% return at 15x relative to my basis of $57. This is not a forecast. I’ve done enough modeling on this company to know there are way too many moving parts to say something more sophisticated than they’ll sell more cars, margins may compress, but even with not a ton of gross profit growth they can still do ok. They way to lose money is if management is completely irrational and continues adding more and more investment into a flat volumes, but I don’t view that as particularly high probability. Here is some dumb, probably wrong math on financials in five years:

Two years is somewhat knowable (it will likely be bad) and five years has a huge spread of outcomes. It’s over longer periods of time the stock gets interesting. Time is actually on your side if they can grow like they’ve done historically and leverage the G&A. Counter-intuitively 10 years out may be more predictable than five. Simple assumptions like growing cars 6% annually (versus 9% historically), profit per car getting back to historical levels, a 2% share buyback, and 15x PE can result in 5x your money.
You’re buying a company that sells a product that isn’t going to change, is the low cost provider in the industry, has consistently generated 30% ROEs, and has grown EPS in the teens for long periods of time. You’re paying 1.7x book and 10x 2019 earnings (when they had 15% fewer stores). I’ve mentally written off the next two years. It’s going to be bad as they continue spending on growth while demand craters, but the balance sheet and liquidity are in a good spot. I don’t have a valuation or even probability weighted outcomes other think you’re setting yourself up for more good outcomes than poor in the next five years and very, very good outcomes longer term.
CSI is a small-cap core processor founded in 1965 to serve community banks. A core system is the primary processing software that reconciles every aspect of the bank flows through to reconcile back to the general ledger. Tracking customer accounts and transactions, opening new accounts, servicing loans, calculating balances and interest, and processing deposits are all typical functions of the core. These are mission-critical functions fundamental to day to day business that have extremely high switching costs. This is part monetary – it costs tens of millions to switch a core on top of paying out the remaining contract in liquidated damages – and part reputational – this has potential to ruin careers if it goes poorly. As a Fiserv executive put it: “For a bank to swap out their core, it’s the equivalent of a heart, lung and brain transplant simultaneously. And . . . everything changes for all their customers. So it’s messy from that perspective”. Only around 10% of banks are ever seriously considering switching core processors and something like 2% actually change in a given year meaning market share is very stable over time. If banks do switch, it will be to one of a handful of competitors with decades of experience. The 10% that are open to switching tend to be banks that are growing quickly or very focused on digital capabilities. These would be banks more concentrated in the FISERV/Jack Henry 1-50Bn bank range. Because CSI services sub $1bn banks, these are not likely to be in those categories, and switching risk is likely even lower than the aggregate market. A small bank is not going to spend the money on a core conversion, spending multiple years of net income in the process, when the current one is good enough.
The very largest banks have the resources to build internal cores and something like 75% are not outsourcing (think FIS/Finastra). Middle market banks in the $1-50Bn range (think Jack Henry, Fiserv, FIS) can vary from complex/tailored to more standardized offerings. CSI’s typical customer would be a small regional bank in AL with 6 branches and 600M in assets. These customers are much more dependent on outsourcing since they have limited IT resources and wallet share is high. All of the core providers cross-sell add-on modules: online/mobile banking, card processing, wires, image capture (taking a picture of a check and processing it), regulatory compliance. Most banks have been consolidating spend with vendors over time, and the core provider is a natural one to do so given everything has to interact with the core anyway. FISV, for example has 39 products to an average customer and Jack Henry close to 30.
Payment for CSI’s services are on a per transaction basis with a sliding scale as transactions increase. Customers sign long term contracts (9 years on average) with CPI escalators. 90% of CSI’s revenues are recurring and inflation protected.

CSI has virtually 100% retention at renewal. The real headwind to revenue is bank M&A, which is really the only time they lose a customer. Around 4% of <$1bn banks are acquired every year on average. Merger activity goes through waves from a low of 2.7% in the 80s and 2000s to 4% in the 90s and 4.8% in the last ten years. If CSI loses a customer to a merger, the bank has to pay out a percentage of the remaining contract in liquidated damages, and CSI discloses that revenue every year. Knowing the termination revenue, and assuming Bank’s pay out 60-80% of the contract and the average remaining life is 4-8 years, you can back into a range of the lost recurring revenue. This doesn’t appear to be more than 1% of total revenue annually and is likely ~0.5% on average. This has been true for the last twenty years while they’ve grown 6%+. I’m not sure why that would be so much lower than the 4% figure, but even saying you have a software company with 4% gross retention is not unattractive. This implies the LTV of a customer is significantly longer than the 9 year contract implies. I don’t think it’s out of line to say CSI has 27 year annuities with inflation protection. [1/(4% M&A * (1-10% CSI market share))].
Given the current revenue base has low churn and there are CPI escalators built into contracts, the lowest this bank can grow if they never signed another contract is about 2.5% (3% inflation less 0.5% merger losses). There are very few companies where a sustained drop in revenue isn’t a realistic prospect. The actual pricing power of such a locked in solution is very high, however, and there’s no reason there won’t take real price. CSI’s higher revenue growth is coming from signing ~24 new customers every year and cross-selling things like bill pay, debit processing, risk solutions. They’ve historically been in the middle of the country and expanded nationally in the last ten years and have much higher name recognition. Market share has increased from 7% to 10% in the last five years. CSI likely has a larger wallet share of smaller customers than other players would have for larger banks which helps grow revenue. You can see in CSI offering pretty basic managed services (web hosting, VPN, email backup) that a large bank wouldn’t need. There’s room to add new products either through acquisition (mostly done in 2000s) or internal development.
Looking at revenue growth after backing out contract termination fees, they’ve grown revenue 6.2% over the last five years and 5.2% over the last ten. EBIT has grown 9.7% over the last five years and 7% for the last ten. There can be a 5 year period where EBIT grows slower as they invest in new products, but it’s never grown slower over ten years. If they never add another client, they can grow 4% essentially indefinitely (3% CPI + 1% real pricing – 1% max merger losses + 1% margin growth). Add new logos, cross-sell, and new solutions, and I think that increases to 6%. ROE is around 21% and they’ve been able to grow while paying out 65% of net income via dividends, special dividends, and buybacks. FCF conversion is incredibly consistent around 15% of sales (net income has diverged from FCF post ASC606). This gives $48M normalized TTM FCF. We know they’ve been signing a similar amount of new logos and CPI will filter in at a high rate. I peg forward FCF at ~$52M conservatively or about 19x.
What do you pay for a multi-decade annuity stream with inflation protection. I think you can pay a big number if you believe it’s as safe as I think it is. There’s really no reason on a risk-adjusted basis you should be getting a 10% unlevered return on this asset (I’m clearly not sympathetic to small-cap/liquidity premia arguments). 30x FCF is not a ridiculous valuation. JH trades at 45x earnings and is really not growing much faster than CSI. FIS and Fiserve trade at 13x EBITDA and are much more exposed to payments and merchant acquiring, which is much more competitive than core processing. I don’t know if anyone will ever pay 30x for CSI given current liquidity, but given they’re now at the $1BN market cap that has more potential to change than it has in the past. I have no doubt that it would trade higher if this was traded on a major exchange. For a 10% return, you should be able to pay 25x free cash flow (4% yield + 6% growth). That’s equivalent to a $1.4Bn market cap. Add in $76M of cash and that’s $49/share. The price today is $38/share for a 5.3% FCF yield which would give you ~12% return. A re-rate to 25x FCF would add 3% to the return over ten years. The fair value I’m laying out is about a 25% discount to today’s price, but I’m also much, much more certain about these cash flows than I would be for most businesses. I can be wrong on revenue growth and maybe it’s 4% growth for a 10% return, but It’s very hard to imagine a scenario where CSI doesn’t beat the market over the next ten years. a P/E of 15 can go to 10 temporarily, but it’s not going to stay there. A permanent impairment of capital would require radically misjudging the switching costs, which just doesn’t seem likely given 50 years of observed behavior for these specific products.
The biggest risk I see is in JH’s talk of unbundling the core and offering some components a la carte. They’re pitching this as moving up market, but you can see how this is an issue if smaller bank’s wanted to start doing this. I don’t know how anyone reads that analyst day in May and isn’t terrified that JH has potential to break the market. Analysts on the call were asking the right questions: “doesn’t this have potentially to mean you’re lowering the castle wall?”. JH’s response that they’re actually just so good that people want to work with them is not comforting. It’s as if the CEO of Moody’s thought all the success was due to execution and not, you know, having near perfect economic barriers. One of the key ways the core providers have exercised market power is not in outright price increases but in forcing customers to consume more in a bundle than they would have otherwise. There are now consultants involved in every core deal, so maybe this is less true today, but unbundling to go after share is not in anyone’s interest. I think the risk is low for CSI because there’s limited internal resources and small bank’s are really leaning on a CSI to do everything. With 9 year contracts, this would take a while to become apparent but it’s something I am watching nonetheless.
Update – Centerbridge and Bridgepoint acquired them for $58/share or 30x FCF. I was in the middle of purchasing, so this is painful. I would estimate that’s ~10% unlevered return. This asset can handle very high leverage, so they’re likely to do very well from here.

The way ad agencies make money hasn’t changed dramatically in the last 100 years. They create campaigns for large corporations and purchase media as an agent on behalf of clients. After a wave of mergers of the large creative ad firms through the 80s and 90s, the big 5 holding companies (Omnicom, WPP, Publicis, Interpublic and Dentsu) came to dominate the space for large multinationals. These firms combine traditional creative agencies, media purchasing agencies, and marketing services like PR, e-commerce, brand consulting, etc. They all similarly hold hundreds of agencies under the same umbrella that service the same clients. Omnicom’s 100 largest clients, for example, are 54% of revenue and utilize on average more than 50 agencies across different brands and client groups. For a large multinational, breadth is critical. They can pull in one agency to work on brand marketing, specialists on a region they’re growing in, an events marketing firm, etc. It’s much easier to have a single touchpoint to service multiple needs. While the traditional agency of record has declined in popularity over time — making it not uncommon for say OMC to serve a portion of a client’s business and WPP another piece — incumbents have a natural advantage in the length they’ve been with a client and institutional knowledge, which leads to high client retention. The closest analogy I can think of are the Big 4 accountants or a blue chip law firm where there are really only a handful of firms who have the breadth to service a multi-national firm. Even if some functions are done in-house, It’s not dissimilar to having an inside counsel but also retain outside law firm for the majority of work. I think the big four accountants and blue-chip law firms will be mostly the same players 10 years for now, and I don’t think it’s dissimilar for the big 4 or 6 agencies.
Traditionally agencies took a 15% commission of the ad budget for their work. That formula started for radio spots and became sacrosanct into the golden age of advertising through the 70s when television dominated. This arrangement meant that as advertising was growing much faster than GDP from elevated television spend, agencies took a disproportionate amount of the economics. Agencies would massively overstaff client accounts to appear less profitable than they really were. Here we get the stereotypical Don Draper, three martini lunch Ad Man. Against this backdrop, Buffett invested in the creative firm Oglivy (now owned by WPP) in the early 1970s on the assumption that agencies were a royalty stream on multinationals expanding abroad (He also bought OMC in the early 2000s and made a bid on WPP in 2012 at ~10x NTM EPS). There was always pushback on the commission structure (particularly on why creative should take a commission), but it took decades until the early 90s to shift a cost plus fee structure, which shows how dominate the firms were. Today, a good rule of thumb is 3% of total billings turns into revenue for Media purchasing and planning and 10-13% for creative work. Even with the shift to a fee model, agency revenue is highly levered to overall spend of the largest advertisers and thus GDP. In 2009 for example, Omnicom’s revenues fell 11% before basically recovering fully the next year. Given how variable the costs are (salaries are >70% of revenue) the decline in operating profit isn’t nearly as intense as other cyclicals. EBIT fells 19% and margins only 1% as they aggressively reduced headcount and the largest 500-1,000 people took 50% pay cuts (also massive equity dilution). The same dynamic played out in COVID with revenues dropping 12% and EBIT 25% only to bounce back shortly thereafter (no dilution this time).
Agency business is not often put up for review, and when it is the they don’t primarily compete on price. When they lose a client it’s mostly on service quality and the quality of ideas pitched. If a firm is humming along, they don’t usually put business up for review. Troubled industries or firms, however, are much more incentivized to switch agencies. F&B and CPG firms, for example, have had increasing pressure from private label and shrinking top lines for years now and have had a wave of reviews in 2015 and 2018. There’s also a social dynamic at play. If you’re Unilever and all the other CMOs are doing reviews, which garner large amounts of trade press, you’re likely to have the CEO/CFO asking why we aren’t doing so as well. Even then, though, the bids on pricing don’t happen until the final rounds of pitching. You can see this lack of price competition in the margins of all the large players which are incredibly stable over time.
The large agency’s competitive advantage comes down to scale. This is most clear in media buying where agencies can aggregate purchasing power among all of their clients to purchase ad inventory. A large client may have a billion dollar budget, but aggregated it can’t match the large agencies. WPP for example is the largest media buyer and purchases $60B+ annually. This also extends into the media planning process (advising on the channels, regions and proportion to spend my ad budget), which is really where the bulk of media arms concentrate their time. This isn’t as simple as saying 50% FB/GOOG 40% TV 10% event/outdoor/billboard. Agencies will consolidate client’s first party data and third party data to target where spend will go. The ad tech stack has only become more complex, and it doesn’t make a ton of sense for marketers to replicate the billions of dollars of spend over the last 20 years on digital capabilities. The moat around a creative agency is also a variation on scale. Saying you work for BBDO has a similar cache to saying you work at Goldman Sachs. The best talent wants to work across multiple projects versus working with mediocre people at P&G marketing (and likely receive less pay), which should ring true for anyone who has worked in banking, PE, consulting, or legal. This makes it difficult for firms to inhouse functions – an evergreen threat since the industry’s early days. It makes little sense for a CMO go to their CEO/CFO and pitch that they should re-create a business that is already globally scaled. Some functions go in house, but they tend to be highly manual and require 24/7 monitoring (social media campaigns are a good example). The need for more scale has only intensified through the shift to digital, which requires much higher content velocity than traditional TV spots. While it’s very easy to set up shop as a new agency, scaling 100,000 employees is a different matter, and having experts in many sub-disciplines globally is not realistic.
Thirty years into the modern Agency Holding Company the industry is still characterized by high client retention, limited price competition, and 2-5% organic growth. This stability of the competitive dynamics coupled high FCF conversion (clients fund growth via negative working capital), makes for attractive economics for the industry as a whole. Starting in the mid 2010s, the agencies started to show chinks in their armor, and their competitive position is weaker than it was a decade ago. I’ll argue, though, that If the agencies were ever going to be disintermediated it should have been in the last ten years when a brand new advertising medium came to dominate, new competition entered the market from consultants, and client business reviews accelerated. While not exactly thriving, the agencies have chugged along. Margins are stable, market share is not dramatically different, and as a group the Agencies have shown organic growth.
Risks to the moat
1. Digital and FB/GOOG oligopoly
The rise of new mediums isn’t new in the history of advertising. Over the last 100 years advertisers have had to switch from radio to television to cable to the internet to mobile, and agencies have been around every step of the way (the “cockroaches of the advertising industry” as one insider put it). What has changed is the rise of technology, particularly programmatic or automated purchasing of ads in real time versus the upfront commitments for traditional media. Targeting has become much more precise and data – whether a brand’s first party data or third party data – is critical to successful campaigns. The strategies have differed on how each Holdco has chosen to approach this change in the past 15 years. WPP and Publicis have tended to do M&A to acquire capabilities whereas Omnicom preferred to build capabilities internally.
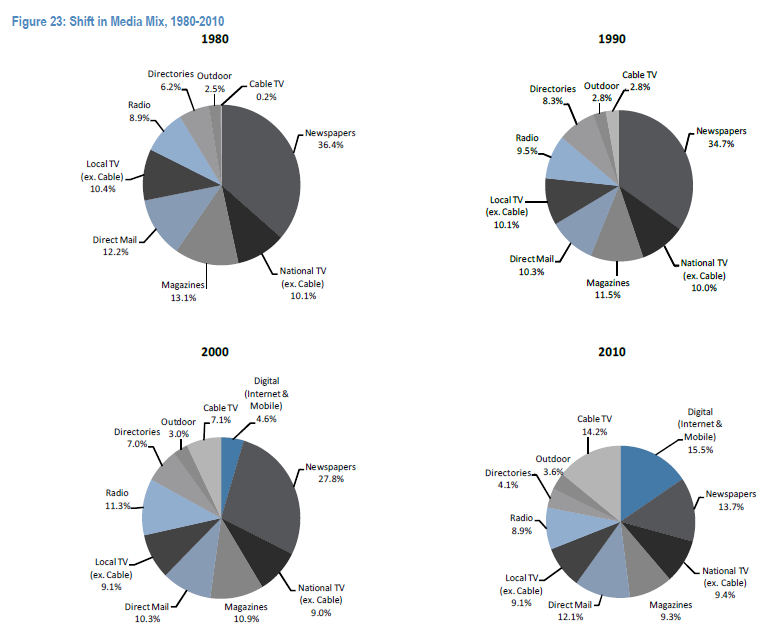
The traditional agency scale advantage of aggregating media buying works well when you’re purchasing from Rubert Murdoch but less so with FB/GOOG with a long tail of SMBs they can rely on. WPP for example purchases ~$10Bn from GOOG annually which is just a fraction of it’s 150B+ of revenue. So purchasing power has declined, but the threat of FB/GOOG going direct to advertisers and cutting out the agencies is limited for a couple of reasons. First, digital will never be 100% of the advertising mix. You can see in the chart below the mix of media spend over time. Categories change slowly over time. Even radio has been ~10% of the ad mix since 1953 to today. Advertiser’s will always do a mix of brand building and below-the-line marketing as they’ll likewise do this across digital and traditional spots. GOOG/FB is a digital duopoly, but it won’t be 100% of the advertising market. Second, The complexity of choice and execution has only increased with the rise of digital, and more importantly programmatic, advertising. The actual purchasing of media is a fairly small amount of the work done in media arms of agencies. The lion share of the work is the analytics and benchmarking that goes into choosing where to spend the budget. The agencies are effectively acting as advisors keeping apprised of the latest trends in ad tech and maintaining relationships with vendors at all points of the value chain, using their leverage to the benefits of clients. When Snapchat went public, the natural question for advertisers was how effective are these ads, what’s the ROI, and does it make sense to shift some spend there. FB and GOOG are not in a position to provide any real feedback there. Even demand side platform Tradedesk works directly with the Agencies rather than clients. Last, on the complexity point, I think people assume a little too quickly the current situation of GOOG/FB dominance is foregone for the next 20 years. Tik Tok got to 1B user quickly. New mediums will proliferate and complexity is likely to continue going forward.
So overall the argument is complexity is good for the agencies from a work standpoint (digital more content intensive than brand advertising) and their Switzerland neutrality as advisors. I would argue the large amount of pitching in recent years was driven by technology changing so rapidly and ROIs/transparency issues becoming so large that firms wanted to see if other agencies had a better mousetrap. This could be ignored when digital was 15% of a budget, but now it’s ballooned to 50%+ and shows no signs of slowing down.
2. In-housing
Client’s taking functions in house has always been a risk. It’s accelerated in the past decade. Consider that only 42% had an in-house agency for some work in 2008 versus 78% today. That’s a big jump. The shift is more pronounced for creative than media buying: 42% of firms have moved some work away from creative agencies versus just 17% for media. Where in-housing makes the most sense is where 24/7 monitoring is required and brands can justify the investment. Social media, website maintenance, mobile application development and even programmatic buying (the mechanical portion) makes sense, but there is still a large amount of work that will continue to be held with the agencies. Even for companies that have taken some functions in house, 90% in a 2019 survey still continue to use a creative partner. There was a fear several years ago that programmatic was being brought in house due to the issues around transparency and measuring ROI. The response of the agency heads was that clients try to take it in house only to eventually outsource again to the agencies with greater appreciation for the work they do; the technology is moving too quickly for a single brand to justify the investment. Of all the reasons for slowing organic growth of the agencies, in-housing and/or scope of work reductions and cost pressures to reduce ad spend make the most sense to me. It seems to me, though, that the long term term is towards outsourcing over time.
As a side note, WPP does some programmatic purchasing as a principal, effectively buying ad inventory on it’s balance sheet and re-selling to clients. They estimated they were able to reduce costs 30% doing this. The issue is this is opaque and difficult to audit. With all of the concerns around transparency, client’s preferred the agent arrangement. I could see a world which trends towards principal buying in the future given the cost savings, though, which would reinforce Agencies scale advantage.
3. Consultants/New Entrants
The fear for at least five years has been that the Accentures of the world will use C-suite relationships to upsell their digital transformation/systems integration work to encroach on traditional creative and media agency work. The pitch is effectively the world has moved to analytics and direct consumer relationships, and they are experts in those fields. The actual activity here is much less than you would get the impression of by just reading trade press. Deloitte and Accenture have acquired creative firms but on a very small scale and all of the CEOS of the major Ad agencies have consistently said they don’t often see the consultants in pitches for new business. Accenture purchased Droga5, a niche creative ad agency in April 2019 with $200M in revenues. The big 4 agencies have $46B of revenue by contrast. Creative firms are also very different culturally than consulting, which would make this very hard to re-create. The heads of the holdcos historically had much less influence than you would think on the individual agencies they own and they’ve let each firm retain their culture. WPP I think got into a bit of trouble through integrating large M&A and trying too hard to blend everything into a “One WPP” type concept. Omnicom on the other hand is much more decentralized, which I think is the correct approach.
4. Pricing/Churn
The idea of procurement having more sway in fee negotiations is not new. This began in the 90s and we’re now thirty years into the current fee structure, but it has increased in the last 5-10 years. Martin Sorrell at WPP was complaining between 2015-2018 about intensifying fee pressures. This hasn’t affected margins for the group as a whole, though, which is what I would expect to see if this were a large issue. The client reviews do seem to have led to reduced scope of work and breaking work among multiple agencies. Conversations around pricing don’t even happen until the final rounds and the agencies have consistently said these large pitches were not about price but issues around transparency in digital spend and the pace of tech changes as well as animal spirits (all the other CMOs are doing it). It does seem wave of client reviews were a bit overblown. “Mediapalooza” in 2015 across all the agencies was only $2-3bn in billings higher than past review cycles (only ~200M of revenue at 10% conversion rule of thumb). The same happened with “Mediapalooza II” in 2018. These were not about Agency fees. One thing WPP said was other agencies were making concessions of working capital. This seems to be a WPP issue only though. NWC has basically remained stable for the other three firms. The agencies do not seem to have swayed from the position that they are not in the banking business funding client’s spend.

Conclusion
I think the agencies competitive position is weaker than it was five or ten years ago. The pace of change has accelerated and organic growth has been lower than past recoveries. That said, I think these firms still have a competitive advantage and will continue to maintain their position going forward. One thing that struck me as I read trade press trying to understand the industry was the level of schadenfreude towards to agencies. Every client win and loss cloaked in a masters of the universe style drama. When an ANA report came out in 2016 stating the agencies were being less than forthcoming about rebates and kickbacks (which they all deny vehemently) every analyst report, earnings call question pounded on transparency on the issue for years. What’s interesting is behavior did change somewhat – some programmatic advertising trade desks were built in house – but GroupM, WPP’s media buying operation, still had 10% growth over the decade. Its not dissimilar to GOOG/FB having transparency issues but then have spend increase every year – a clear sign of market power and dominance. I don’t think the agencies are anywhere near that level of dominance – and their competitive position has changed substantially in the last five years – but I think it’s a mistake to assume they are going off a cliff. If they were to be disintermediated it should have been in the last decade.
Growth
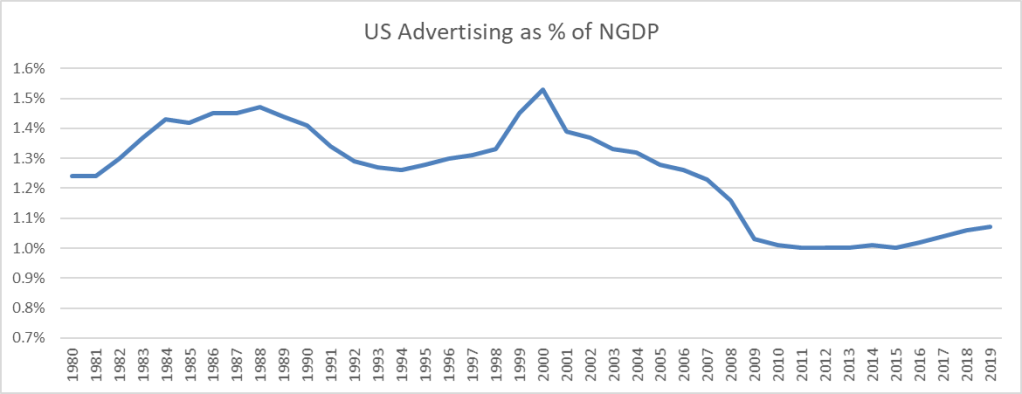
The Agencies have been almost perfectly correlated to overall Advertising spend and NGDP. Prior to the financial crisis, this meant growing at 5% organically as a group. Growth has been substantially slower since then. It was 3.6% between 2012-2016. Given 2008/09 was the worst advertising recession in history (worse than the great depression), that’s understandable. The below chart doesn’t do full justice to how long the cycles are in advertising. 1980 is actually low the point over the last 100+ years, so ad spend is very depressed relative to history. Now I don’t know that will ever come back to the same levels. You can argue the Ad Tech and ability to better pinpoint ROIs has caused permanent deflation in Ad budgets. That’s certainly possible. It’s just worth keeping in mind there has been 10-20 years of cyclically depressed Ad spend relative to NGDP even as new mediums proliferated.
What’s more important than the overall cyclicality of the industry is the recent divergence between Ad spend growth and the Agency Organic growth. You can see they have all had anemic growth relative to ad spend starting around 2015. There’s also been a divergence between the American (OMC/IPG) and European peers (PUB, WPP) with no one reason explaining it all. WPP/PUB, for example, over-index to CPG at around 16% versus 8% for IPG/OMC. Faced with slowing growth, this vertical have been much more likely to reduce spend on traditional brand investment, move studios in house and rely on more traditional trade/promotional activities. IPG, by contrast, under-indexes to CPG and has twice as much tech/healthcare exposure which has helped organic growth relative to peers. Other reasons can be business mix and general holdco strategies. IPG has long been organized in an “open architecture” where talent can be reached across agencies. Omnicom in the last five years adopted a practice areas/client matrix organization. WPP/PUB have adopted similar organizational changes to open up the entire organization but have generally lagged American peers. All of that said, this isn’t the first time specific firms have had trouble. IPG, for example, has outgrown all of the peers in the past five years but had a horrible time underperforming in the early 2000s.
The general growth question — why are ad agencies not growing in line with NGDP or overall Ad spend — is really the heart of the worries around disintermediation. Martin Sorrell, CEO of WPP until 2018, has been fairly dismissive of most of obvious headline explanation (FB/GOOD duopoly, consultants, in-housing) and thought the explanation that made the most sense was a reduction of spend from the F&B and CPG firms facing limited top line growth and general multi-national focus on cutting costs and reducing marketing spend. What it doesn’t seem to be is direct competition given the stability of margins, which would frankly be more concerning to me than having all these theories floating around why organic growth is lower than historically. My best guess is it’s a combination of scope reductions and in-housing and the lower growth is cyclical rather than structural.
John Wren, CEO of OMC, recently re-iterated the belief that this is a NGDP+ growth business over the long term. I’m not sure that’s going to be the case, but don’t see why it wouldn’t grow at least with inflation if I’m right on the competition and necessary role of agencies in the current world. Given some of these firms are being priced as if they will decline into perpetuity, the question is not as critical as it would be if they were at 20-25x earnings. OMC has been the most consistent on the organic growth side, but that’s also organic after divesting underperforming marketing services over the last several years (almost 10% of the company). The business that exists today has been growing organically 2.5-3.5% from 2016-2020.


Valuation
Most of the above has been focused on the agencies as a whole because frankly they’re interchangeable to a large degree. The critical points – is there a role for agencies, is competition still moderate between agencies, can they still grow alongside Ad budgets – are industry questions and not specific to any one agency. If the above are answered positively, the next question is really views on capital allocation. On that front, I tend to like OMC the best even despite IPG’s above strong performance recently. John Wren has focused on building digital capabilities in-house and has been very disciplined on M&A. I think WPP’s strategy of acquiring large digital acquisitions to integrate caused a lot of financial and operational issues in the last ten years. Wren has been incredibly consistent on capital allocation for 20 years; you can go read the early 2000s transcripts and it reads exactly like this year’s call. Wren will likely retire in the next five years, and I expect the new CEO to be internal. Given the limited need for capital — clients fund operations with negative NWC — OMC pays out virtually 100% of cash flow every year. The mix has been basically 25% dividends, 55% repurchases, and 14% on smaller bolt-on acquisitions. Wren has signaled he’s going to be somewhat more aggressive on M&A, but I don’t expect a large multi-billion dollar acquisition any time soon. A similar mix of cash return is a good bet going forward.
Omnicom is trading around 9x earnings ex cash. Finding excess cash requires some assumptions since they do maintain a high balance at all times. I looked at long term cash as % of sales and as a % of working capital. My best guess is around $1.5Bn of the $4.4Bn cash on the balance sheet is truly excess. Maybe all of it is excess, but that’s probably too aggressive given how they’ve acted in the past.
Historically they’ve traded around 13-20x earnings, which is a reasonable range given how bounded the growth rates are. Pick your WACC and LT growth rates and the right multiple is somewhere in the 13x (2% perp growth, 10% CoE) and 25x (4% Perp growth, 8% CoE). 1% growth can come from M&A alone, so this is the same as saying a range of 1%-3% organic growth. Where they’re trading now is more in line with the financial crisis or the worst of COVID. The market price implies a -1% organic growth forever at 10% CoE and -4% at an 8% CoE.


At today’s prices, Omnicom has a 4% dividend yield and can repurchase 3.6% of it’s float net of stock dilution. The remainder free cash flow will be spent on M&A and add 1% to growth. So before taking into account organic growth — which requires no capital — OMC should return 8.6%. My best guess on organic growth is 3%. So if multiples never rise form here, OMC should return ~11.5%. If the multiple re-rates to 15x, this would add 5% to that return over five years and 10% over ten years. That’s all depends on your repurchase assumptions, but it’s directionally correct that the business can return at least 10% comfortably and a re-rate get’s you into 15%-20% territory.
You can play around with a simple 5-year dividend discount model and get the range of fair values. I’ve assumes 4% growth (3% organic + 1% M&A) and repurchasing shares at 10x EPS. My best guess is OMC is worth at least $100/share which is ~35% discount to today’s price. Paying up to ~$130 is not unreasonable if growth is a little faster. It trades at ~$68 today. This model isn’t saying much more than the correct range of values is 15-20x.

Company Overview
Truxton is a Nashville Private Bank founded in 2004, which has operated out of a single branch since inception. Whereas Wealth Services — trusts, estates, portfolio management — is an add on for most banks, it is their core service. Trux is a financial advisor with a bank attached and a pure play on wealthy Nashvillians. Their 185 clients are successful white collar workers or small business owners with around $5M of investable assets, on which Trux earns a 0.8-1% fee, and another $1-4M of deposits where they earn a spread like any other bank.
Trux has a cost advantage in concentrating it’s operations in a single location. Higher balances per depositor and high deposits per location allows it to earn mid teens ROEs at zero interest rates. Given the wealth division is the true customer acquisition engine, it doesn’t spend much money on marketing or maintaining costly branches. The customer base is sticky — if you’ve consolidated most of deposits, estate plan, portfolio accounts and potentially are a borrower to a single servicer, it’s quite the project to switch.
Growth
The bank has grown dramatically in the last ten years. AUM has tripled — partially as a result of market growth – and deposits have increased 4.6 times. The company doesn’t disclose total client counts other than saying they had 185 wealth clients in 2019, but in 7 of the last 10 years the Chariman has said they’ve added new clients. Disentangling client growth from market growth on the Wealth business is difficult. Assuming something like a 50/50 allocation to stocks and bonds, though, would imply new money has increased at a 7-8% CAGR since 2010 (15% revenue growth less 14% S&P CAGR x 50%). Deposits have grown 14% annually. In theory, deposit growth should be more levered to new customer growth, but it’s difficult to know how much of this was consolidating accounts, kids adding money, etc. I say all this to point out that the headline “organic” revenue growth of 13% over the past ten years is probably overstated a bit and is likely 3-5 points lower.
There are a few components to the future growth of the company. Overall a conservative forecast is the business can grow revenue 8-10% over the next decade through 4% new money + 2% market growth + 2-4% net interest margin expansion
Net Income growth was dramatic in the last ten years, growing at a 30% CAGR as it gained scale over a largely fixed cost base. Compensation, in particular, decreased from 56% to 39% of revenue, but nearly every cost center shrank as a portion of revenue. The next ten years will be more modest, but there is still operating leverage. They’ve gotten to reasonable scale with non-interest expense rising from $6M to $17M in the last ten years. The majority of that is compensation and somewhat fixed. You’ll eventually have to add heads if clients scale dramatically, but it won’t rise proportionally. I don’t know what the breakpoint is (35 clients per advisor? 50?) but in assuming each advisor brings in 1-2 clients, there is a long runway before you reach it. The advisors come from banks like Suntrust and understand what a fully built back office at a large bank looks like; I’m guessing here, but I would think adding client service/back office staff at a $50-70k salary can go a long way in gaining efficiency.
If top line can grow 8%, net income should be able to grow 2-4% faster. They dilute their stock 1-2% per year, and based on the lastest proxy will continue to do so in the future, so I think EPS can grow around 10% per year.
Bank
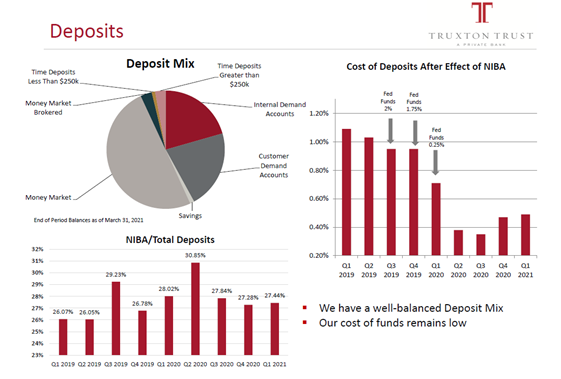
The bank is primarily funded by deposits from clients (87%) and equity (10%). Of the deposits, 23% are non-interest bearing. Deposits are a mix of 40% transaction accounts and 50% MMDAs. There’s nothing that jumps out to me as exceptional in their funding profile or what they’ve paid relative to similar banks. It’s reasonably cheap money that doesn’t overly rely on CDs/Brokered Deposits/wholesale etc, and their advantage isn’t really in gathering the cheapest money anyway.
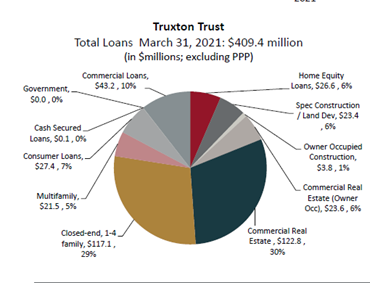
Earning Assets today are 57% loans, 30% securities and 13% cash at FIs. Historically loans have been 70% of earning assets (80% LTD) but more capital has moved to cash and securities as deposits have swelled in the last two years. There should be enough loan demand in Nashville to bring that up over time.
The loan mix is concentrated in CRE and single family residential. With 75% of loans maturing withing 5 years and 13% at FIs earning nothing, there’s room for NIMs to expand over time as rates rise. My suspicion is the C&I, HELOC and consumer loans are all wealth clients. Likely a part of single family lending as well, which would put client lending in the 30-40% range of the loan book with the remainder local lending in the Nashville market. It might be much more and Trux is funding client’s CRE projects, but I can’t prove that. For these borrowers, Trux has high visibility into their financial picture and is lending against customers with a large amount of liquidity. Trux has had basically no loan losses since inception and so uses peer loss estimates for reserving. I think they’re likely conservative but not exceptional lenders and the strong results are more a function of lending to liquid borrowers and a strong Nashville market than anything.
The securities portfolio is skewed towards Munis (37%) MBS (28%) and ABS (17%). I’m not in love with this as the MBS in particular should get hit both by higher interest rates and higher duration as rates rise. With all of the MBS, it’s difficult to get a gauge on the actual duration of the securities holdings – I know that at least 35% or so is explicitly greater than 15 years and at least 50% is greater than 5 years – but the MBS/CMBS skews things a bit. Either way, it’s longer duration than I would like and there will be mark to market losses as rates rise, but it’s also only 1/3rd of earning assets.
My largest worry is the concentration. There are fewer depositors and fewer borrowers than a normal bank. If client’s start churning faster than you’re getting hit both on the wealth and banking side. They’ve historically run with low leverage ratios and part of me thinks this is a response to that concentration rather than conservatism.
Mgmt/Capital
Management owns a decent amount of stock and most of the original founders are still there. The advisors are not that old, either which is good for future leadership. Given they don’t do M&A, the only real thing to worry about is lending, which they’ve shown they can do a good job of. The only thing I’ll add is on a podcast interview I listened to with the CEO he droned on about playing at Augusta and how he loves taking client to the Masters, which is all you really want from a Private Banker. This is at the end of the day a levered play on a bunch of Frat Stars chumming it up.
The advantage of having such a large % of the business in wealth is it limits the capital required to grow. Market growth, NIM expansion, and a portion of new client growth don’t tie up capital; deposit growth does. Under the assumption I laid out 10 new clients per year is $30M of incremental deposits, which would require $3M of equity assuming a 10x leverage ratio. It’s hard to pointpoint the exact deposits per customer, so maybe $3M/per customer is incorrect. If deposits grow 8% at the high end that would require retention of about 50% of net income each year. That number makes sense given the special dividend in 2020 was around a 50% payout ratio. I suspect that’s the max though and they can continue to grow while paying out 60-70% of net income, but I’ll assume 50% for conservatism. With 15% ROEs, it earns enough to fund any growth internally.
Valuation
Trux trades for 14x LTM EPS. Price to book is less relevant given how large a contributor wealth is to income. Paying 14x times for a company that can grow 8-10% per year and has 15% ROE is reasonable. Assuming they can pay out 50% of net income implies the stock yields 3.6% while still growing EPS 10% per year.
14x is reasonable, but I would argue the multiple should be higher. The Wealth and Net Interest income are really not separable, so this is a bit of an academic exercise, but assuming the bank should trade at 18% of earning assets implies the WM piece is worth $42M. I estimate WM generates about $5M of net income so you’re valuing the WM piece at 8.5x earnings, which is too low.
Valuing the bank at 18% of earning assets (implies 10% ROE when netting out the wealth contribution) and wealth net income at 15x P/E implies 20% undervaluation. That’s not huge, but it’s some support the multiple should be higher. I don’t know that this will ever happen – this is an illiquid, OTC microcap – but it’s not out of the question. The business return can get you low teens and there is maybe some possibility for multiple expansion.
Long at $61.50
“It strikes me that if I were to describe our business without ever using the words QVC and HSN, [and talked] about curated discoveries and immersive, rich video experiences and social and influencers and low marketing costs and high customer loyalty and frequency. It would sound like a pretty amazing business, a pretty cool start-up, very relevant for today’s world” – Q3 2019 earnings call
“You talked about in the past that the public markets have a tremendous trouble with businesses that are . . . for a lack of a better word, something of a melting ice cube conceivably. Even if they produced a large amount of free cash flow, but if the growth story is not there, there is going to be this secular overhang.” Analyst, Q2 earnings call
Thesis:
QRETA is trading at ~25% LFCF yield, and management plans to return the majority of cash to shareholders. The future is highly uncertain, but the customer base is incredibly sticky. 70% of revenue is from 16% of customers, a rabid group of superusers with 99% retention; 92% of revenue is from existing customers with consistent 89% retention. The company may or may not transition successfully as it’s distribution model increasingly switches online. It’s stable in the short to medium term, though, and returning cash quickly enough that you don’t have to underwrite much of a terminal value to get good returns.
Company Overview
For the last forty years, Qurate (QVC/HSN) has sold merchandise through it’s flagship HSN and QVC networks as well as QVC2, QVC3 and HSN2. They develop cheap content across 36 studios and broadcast 20 hours per day, 364 days per year to 380M pay TV homes. Qurate sources products from thousands of vendors and does test runs with a few slots to get feedback, allocating larger air time to successful products. ~25% of featured products are new everyday, meaning the product cycle is quick and new content has to be developed rapidly.
The products are ~33% exclusive brands and collaborations with influencers, 25% limited distribution brands/unique items, and 40% leading national brands (e.g., Keurig, Apple, Marie Claire). The goal of the leading brands is to offer some unique aspect not available online (special bundles, unique colors, etc.) at a competitive price point to online options. Given the breadth of the company’s reach, Brands are eager to work with the company.
Customers
Customers are ~44% women between ages 35 and 64. The average age is likey closer to mid fifties. The demographics certainly skews older but this has been a long-term phenomenon: most women don’t begin engaging until they have a family and larger disposable income beginning in their 30s. The age cohorts for existing and new customers has remained stable for the last fifteen years even with the pandemic and the rise of streaming. These are savvy shoppers (3x more likely to shop at Saks than the general population; active price comparers) with above average household wealth.
The existing base is surprisingly sticky with 90% retention rates, which has been stable for the last 12 years. The products are always rotating, so this isn’t brand loyalty as much as a connection to the programming and personalities. There is clear habit formation as customers engage with the content, leading to 92% of sales coming from existing or re-activated customers (purchase in last 24 months but not last twelve months). New customers are much less important than keeping the existing base engaged.

The real driver of this business, however, is super users who make up 70% of sales. You can see some of the stats below which are a bit mind blowing. Spending 18 days per month on TV and 33 web visits a year is clearly a habit. The overall spend is basically 15% of disposable income taken in $50 transactions across the year. For whatever reason, there is something like 1.9 million women in the US who are fanatical about this. Of the 3M or so new customers every year ~2% will become “best customers” within a year and 2.6% within three years. These conversion rates have been improving over time.

“It’s a very small number. 32,000 people, that’s the number of the 2.3 million will become best customers. And best customers in the year they join. And a slightly bigger number, 77,000, who will become best customers within 3 years of joining. They represent 70% of our sales. And guess what? Despite cord cutting, despite Amazon, despite all of those fear factors, the percentage of new customers is growing and the percentage of new customers who become best customers is up over the last 5 years.” – Q3 2019 earnings call
I took a stab at modeling the existing customer base piecing together various assumptions from presentations and calls. This was really just to play around with the assumptions. There’s nothing that’s not intuitive here. The majority of revenue comes from best customers. If you can’t retain them, revenue falls off a cliff. New customers don’t really add much, but you need to get in front of enough eye balls to convert those to best customers. If the conversion rate falls, revenue also falls off a cliff. Posted below if anyone interested.

Distribution/Marketing Funnel
The historical strength of the company has been its distribution advantage. QVC/HSN channels are carried on 99% of those with cable, or ~94M television households. It reaches 380M pay TV homes worldwide across 15 networks. Since the cable companies get paid to carry and get 5% of shipped sales, there is limited incentive to cut them on a skinnier bundle (as seen in them being added to Youtube TV). They offer value to cable and OTT as a way to diversify their revenue streams.
Obviously overall subs are decreasing rapidly at ~4%/year, but existing customers are much less likely to cut the cord than the overall population. For the superuser, I imagine it’s even less likely; If you’re watching QvC 18 days per month, probably for hours in the background, you’re probably not going to let your husband cut the cord. Even if you do, you’re highly likely to download the app.
“Cord-cutting is less relevant to our customer set, whoever that is on a relative basis. Not to say we don’t suffer from it, but compared to who cord cuts, who is cord shaving, it’s a younger audience, it’s not the audience that is our traditional buyer” – Q2 2019 earnings call
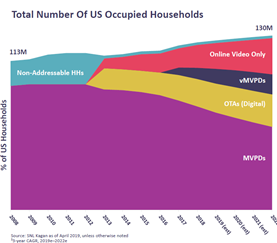
“While our MVPD homes have declined from a peak of 99 million in 2015 to 80 million today, a vast majority of consumers in our target demographic still have a pay-TV service. And so our multi-year investments in 5 networks with attractive channel locations still provides a unique advantage over every other retailer” – Q3 2019 earnings call
A portion of sales are from people channel flipping, making the location of the channel relative to high traffic channels critical. Qurate incentivizes this placement through additional fees to the cable providers. Some of this serendipity is obviously lost online. It’s easy to see how this could translate to Youtube TV or Hulu+ but much more uncertain on how this translates to other OTT offerings.
Qurate has been broadening distribution to VMVPD’s (AT&T TV, Youtube TV, Hulu) and OTT (90% penetration in the likes of Apple TV, ROKU, Fire, etc.) and has been expanding into other channels like Youtube, Instagram, TikTok. It would be hard for this to replace the advantage of cable, but it does mitigate the distribution pressures somewhat.
Customer acquisition today is 60/40 cable vs. marketing. Cable is 100% incremental margin as the television rights have already been purchased. As the distribution platform slowly erodes you get de-leveraging in having to spend marketing dollars and potentially draw a more transactional customer. TV is a massive audience, but it’s also scattershot. I think there’s a plausible argument that marketing via Facebook/Instagram allows more precise targeting. Given how few best customers the company actually needs in any given year, any improvement in conversion is highly advantageous. Initial indications are that customers coming in through paid marketing are exhibiting some of the same stickiness as seen historically.
“Looking at the surge in new customers at QxH, for example, nearly 2/3 of these new customers are coming to us organically (paid TV), a reflection of the power of our brands and reach, and the remaining 1/3 are the discovering us through paid marketing. And the percent of these new customers who are making a second purchase within a 14-day or a 28-day window is comparable to classes from prior years, an early but strong indicator that these new classes may have a similar lifetime value” Q2 2020 earnings call
The market clearly doesn’t believe the pivot is going to be sucessful. The way the company engages with customers is certainly going to have to change in the next five to ten years. I don’t have any special insight into how successful they’ll be at this. I think there’s a non-zero chance they’re able to pivot, but I’m not confident enough to underwrite anything there. The bet here is really what you believe in the next five years, which I’m comfortable with for a couple of reasons:
Competition
“And I think it’s not widely understood just how big our competitive advantage is in content because the amount of content we produce, our experience base and content creation, resources at our disposal globally are just overwhelming. And the thing we’ve learned is that these live streaming platforms are content beasts. And to be able to have great high-quality content that’s fresh every day, so if she wants to come back every day, is this huge barrier that others are finding”
“We have spent 40 years refining the art and science of telling engaging stories to live video shopping in ways that inform and inspire, drive impulse and urgency, built trust and lasting relationships and bring customers back to our platforms nearly every day. This stands in stark contrast the most live stream shopping today, which is focused on one-off marketing events that build no relationships and will struggle to create enduring value.” Q1 2020 Earnings call
The counter argument to this is why can’t Amazon throw a couple hundred million into this and integrate into their website? They’ve already launched live cooking, retail sections. They absolutely could, but I think there is clearly expertise to partnering with personalities, sourcing products that have a story element as well as managing the logistics of a quick burn product cycle. That’s not to say a start up can’t be competitive, but I do think there’s more institutional knowledge here than meets the eye, and combining production with constantly new product offering is not most retailer’s core competency. There are tailwinds in video based shopping, but It’s not clear Qurate will be able to capture the growth.
The traditional scale advantage, which is how Qurate was able to attract brand partnerships, is eroding and competing online is a much bigger pond than on television. Is there any reason to think brands don’t become more sophisticated over time? Is Qurate going to capture a fair share of the broader video shopping market? Again, I don’t have any solid answers there on how successful they’ll be.
Capital allocation
“At a high level, what we’ve stated publicly is that we’re focused on returning the majority of our excess cash flow, free cash flow to our investors, and that we’ve used a couple of instruments to do so recently, as you all know, buybacks and special dividends, principally. We like that mix and we like the flexibility that, that gives us to reflect on the best return at any moment in time for our investors. And we would expect to continue to deploy both those mechanisms over time, to return cash to shareholders. Now we don’t currently have any plans for major acquisitions or divestitures. That’s the kind of topic you never want to say no to. And so certainly, we wouldn’t rule out the possibility that some interesting acquisition would emerge that we thought may — would be a better use of cash than directly returning it to investors. ” – Maffei Q2 2020 earnings call
The acquisition record has been terrible to say the least. They paid $2Bn for Zulily that they took a $1.2Bn writedown on. Sales are down 10% since 2018. HSN had massive churn when they acquired and a ton of integration issues (though they are 70% of the way there on $200-300M in annual synergies).
The company has pretty consistently been buying back shares into a falling share price. They were aggressive with repurchases and then stopped during a terrible 2019. The company cites integration issues, a cyclical slowdown in fashion (higher margin, lower ASP) and natural product cycle (the 10 largest brands accounted for all of the sales decline) as the culprits. While this all may be true, they also took a wait and see approach to resuming buybacks showing that there was real uncertainty on the stability of the business going forward. Maffei cited the poor return on buybacks as a reason for returning capital via the preferred last year as well as wanting to give shareholders a choice between the preferred and taking a view on a more levered common.
I think the lack of buybacks and the fact that Malone is selling shares points to the conclusion that they don’t really believe in the business. But, you know, I don’t know that I do either long term? It’s highly uncertain how this all plays out, and I don’t know that I disagree that taking capital out until the business stabilized was a smart move. I am comfortable, though, that they’re not just keep throwing money into a melting ice cube. They will take capital out if the business really deteriorates, which mitigates the downside.
Valuation

At around 3-4x FCF, Qurate is too cheap. Customer count and revenue has held on to the massive COVID tailwind giving me more confidence in the staying power of the business. There’s a huge span of outcomes on the terminal value, but you could keep multiples constant and still have a very good outcome given how much you can buyback of the stock. Debt is high but there’s plenty cash flow available to service.
Conclusion: long at $11.5/share
I have too much cash in the tax-advantaged accounts as I’m not comfortable holding index funds with a 38x CAPE ratio, which I’d be doing in any other environment. This is a different bucket of capital then my discretionary PA. Here I’m looking for reasonably safe companies where my confidence level is high that returns will be high single digits.
I’m unsure of what the index will do over the next five years, but It’s not terribly hard to predict what the general market will do over the next 10-15 years at these valuations. CAPE ratios are a surprisingly predictive metric over longer periods of time, but you can do any metric you want and receive similar answers. A 2.6% earnings yield + 3% inflation = 5.6% nominal return if held forever. If the CAPE ratio re-rates to even 25x (well above the long term average of 15x), that return goes down to 3.5% over 20 years and 1% over 10 years. That same math applies to dividend yield + growth. This is all at a time when profit margins are abnormally high due to a combination of low labor bargaining power and probably unsustainably low tax rates. So I’m comfortable saying the next 10-20 years the market is returning low single digits at best (Confidence: 80%). I’m not arguing whether this is fair value or not – maybe it is with interest rates where they are — but that I’m simply not willing to lay out capital for that bet.
Thesis
Frost is a regional bank based in San Antonio doing business primarily in Texas. It has one of the lowest funding costs in the country with attractive branch economics ($220M+ deposits per branch) that allows it to earn reasonable returns in a zero interest rate environment. It does this even with an abnormally liquid balance sheet (~50% Loan to Deposit), reasonable leverage (10x Assets/Equity), and conservative lending (30bps charge-off since 2000).
If interest rates stay zero forever, Frost should reasonably return high single digits as a buy and hold stock. If rates ever rise to something like a 3% Fed Funds Rate in the next ten years, Frost is significantly undervalued, and returns are closer to 15%+.
There are plenty of cheaper and more interest rate sensitive banks that will return more if rates rise. This is not a bank to express a re-opening or macro view — I certainly have none. But Frost is safer than most banks and allows the macro agnostic a way to sleep at night: acceptable returns if the US is the next Japan; great returns if the V in MV=PY wants to get the band back together.
Company History/Structure
For general background on the company, Geoff Gannon has a great writeup from 2014 (google “Singular Diligence Frost”). A lot of the ideas/framing here are lifted directly from there.
Balance Sheet
Lending
Loans – 43% of Earning Asset
Frost has a much more liquid balance sheet than most banks. Having gone through the 80s oil bust, when their balance sheet and the TX economy was much more levered to energy, management tends to be very conservative. Frost doesn’t lend out deposits for the sake of it, averaging ~55% loan to deposit ratio for the last twenty years. This crept up prior to the financial crisis, but it’s been relatively consistent over time. Currently it’s at ~43% whereas the industry is closer to 70%. An SMB loan is riskier than a Treasury or Muni, so this is one of many ways Frost is a safe bank.
Frost is a business bank with only 12% consumer loans. The C&I customers tend to be SMBs in Texas ($10-$100M sales), which is likely skewed to San Antonio. This will change over time as they’ve opened 26 branches in HTX and plan 30 openings in DFW. As those branches mature more loans will be made in those cities.
Frost’s model is heavily relationship oriented. Before lending it tries to get a core deposit relationship meaning the business’s primary deposit account, credit facility and 3-4 director/executive personal accounts. Lending is a commodity so they lose plenty of loans, but it certainly would be in the running for a core customer’s loan.
There are $12.7M in commercial and individual deposits and something like half to 2/3rds of that is commercial. C&I and energy lending is around $6B, so in a sense they’re taking core deposits from a business and re-lending it to those same businesses. The same isn’t true of the real estate side where it’s taking consumer and other business deposits and lending to RE customers. The real estate side is much more transactional, but it is 46% owner-occupied, which is generally less risky than real estate development/multi-family, etc.
The energy loans are primarily PDP production loans. Loan commitments are limited to 65% loan to reserve value (PDP), 1.0x coverage on 25% decline in prices, and 3.5x EBITDA. These are 7.0% of earnings assets. They’ve been clear they are moving away from energy and want to make it mid single digits over time as facilities term out. PDP lending is specialized but given Frost’s history in the business and the intention to bring it lower, it’s not an out-sized risk.
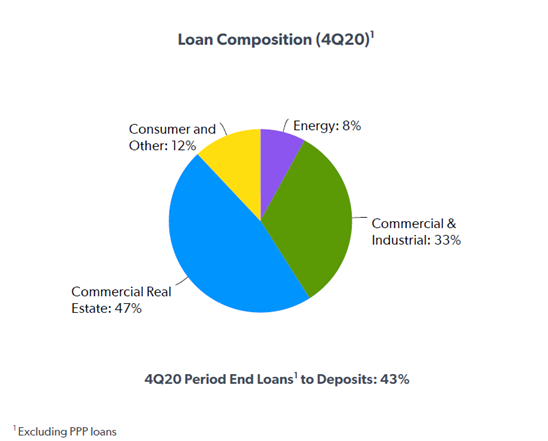
The culture of Frost is conservative, which is a nebulous thing to define let alone put a value on, but in my opinion it’s a durable characteristic: culture can change, but slowly over time. This show up clearly in the lending record. Net charge offs/avg. loans have averaged 0.3% since 1996. This isn’t as good as Prosperity Bancshares, another Texas bank and Frost’s closest comp, but still very much better than Texas banks and certainly better than US banks in general. Frost performed better than most banks in the financial crisis. Part of the reason the LTD ratio is low is Frost is reluctant to loan deposits as credit conditions get stretched like they are today. The funding cost is cheap enough that it frankly doesn’t need to have 80/90% LTD ratios. It’s balance sheet isn’t overly levered, typically running ~10x asset/equity. Statutory ratios have plenty of cushion.
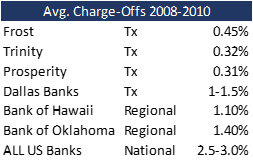
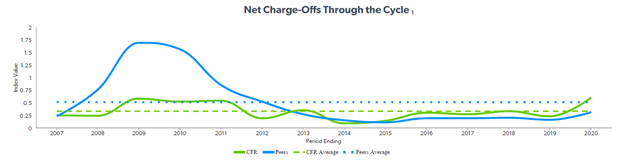
Securities – 57% of Earning Assets
The securities book is high quality – 93% AAA rated – with a mix of Texas Munis (70%), Treasuries (9%) and MBS (21%). These will show some MTM losses if rates rise, but 1) the duration is only 4.4 years 2) losses won’t affect statutory capital, so no risk they’ll need to raise dilutive capital. These can be invested at much higher yields as rates rise.
Funding
Frost has one of the cheapest funding costs in the country. Deposits are 88% of earnings assets whereas that may be closer to 60% for the average bank who funds the net with higher cost CDs or external financing.
The deposits themselves are extremely cheap. Non-interest deposits are 43%, which is probably the highest in the country. Most banks have closer to 20-25%. The remainder is in checking/savings (extremely cheap) and money markets (slightly more expensive but still cheap). These are much less runnable than other sources of hot money.
This is fundamentally the moat of the firm. Not unlike a commodity firm, Frost can produce money cheaper than it’s competitors.


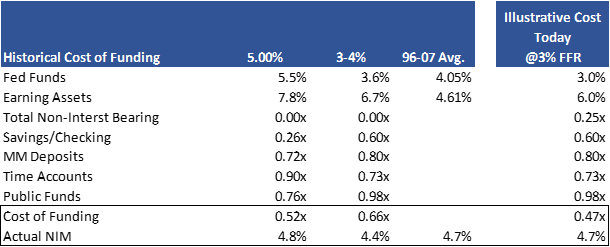
Looking at higher interest rate environments, when the Fed Funds rate was ~3% in the early 90s, Frost was paying 0.6x the FFR on Savings/checking and 0.8x on MM accounts. This is obviously tricky as pricing lags as interest rates change. I tried to pick a couple of years where rates were stable, but this is obviously an illustrative calculation.
The non-interest deposits historically have been free, but this will change with the repeal of Regulation Q as a part of Dodd-Frank. In the past, banks were unable to pay interest on commercial demand deposits which is not the case anymore. This isn’t relevant today as interest rates are zero, but even on the initial rate hikes a few years ago, corporate Treasurers could do the math and the opportunity cost became too steep not to move funds around. They began putting some corporate deposits into sweep accounts paying a higher interest rate. Frost didn’t lose the customer but did have to pay more. Frost assumes in it’s 10k it may have to pay a 0.25 deposit beta on these accounts, which it considers conservative. It will take time for the market to sort out what it will pay and how much competition there will be, but I think a fair assumption is these non-interest accounts will have to pay something closer to a checking account.
I’ve assumed that the non-interest deposits will start paying 0.50x Fed Funds rate as rates rise, which is more conservative than management’s estimate. I estimate that the non-interest deposits are 50/50 business/individual, so 0.25x for non-interest accounts in aggregate.
Applying these to the current balance sheet (very low cost deposits via checking and non-interest are 70% today versus 50% then) implies ~4.7% NIM if rates were 3.0%. You can cross check this to the historical Net interest margins and this doesn’t seem crazy.
Frost in general pays less than competitors on deposits, but retention is still very high at 90%. I think there are several reasons:
Efficiency
Frost is not overly focused on costs but it has some of the highest deposits per branch in the country, which is a reason it’s so profitable. Frost has $225M in deposits per branch (almost certainly understated since it has 26 subscale new Houston branches) whereas other large competitors in Texas are closer to $100-160M. Frost has historical grown deposits per branch at ~5.5% over time. The scale advantage from spreading employee and occupancy cost over a growing deposit base is significant.
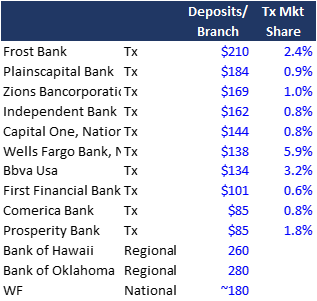
Consider the closest competitor, Prosperity Bancshares, which is highly acquisitive and known to be brutal cost cutters. PB has an Opex/avg. assets of 1.9% vs. 2.9% for Frost.
What’s interesting, though, is how this has trended over time. Frost had 4.3% in 2001 versus 2.4% today. PB had 2.6% in 2001 and 1.7% today. PB increased earnings assets 25x since 2001 while Frost has increased earnings assets 5x, yet Frost had almost double the efficiency gain. PB has created enormous value through M&A, but the unit economics of Frost are more attractive.
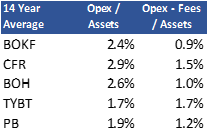

Right now with the branch expansion in Houston and Dallas there is a certain level of cash burn until the branches become breakeven (typically 3 years post opening), so these levels will come down over time. Management has said there’s no real reason the deposits per branch at these locations shouldn’t be closer to the corporate average as they mature.
Frost has a decent non-interest business (Trust, ATM, etc.) that offsets those costs, but it’s not a great cross-seller. It’s a nice diversifier but really secondary in the scheme of things.
Growth
Frost tends to grow organically versus through M&A. They’ve grown deposits ~8% for the past 25 years despite losing market share. Frost has 2.5% Texas market share today, 2.81% in 2010 and 2.84% in 2001. If the US overall can grow 4-5% long term (1% population + 1% productivity + 2-3% inflation), then Texas should be able to grow about 1% faster than that from population growth.
Saying 5-6% long-term growth seems like a conservative estimate. Frost has historically grown deposits at 8-9% with a lot of cyclicality. That’s not a crazy assumption going forward given their position in Texas and the lack of net new banks openings. I think a fair appraisal is that one can be highly confident Frost won’t grow slower than 6% and a very good chance it’s higher.
Capital allocation
The current management team is older and has been with the company for the past 30+ years. One of the biggest risks is loosening lending standards, but again I think culture changes slowly over time, and the new leadership will be internal. Frost has historically paid 50% out in dividends and retained the rest. There are some stock buybacks, but it’s more sterilizing option issuance. I don’t expect that to change going forward.
They do M&A periodically, but it’s not a huge part of the strategy. They’re clearly aggressive at looking at deals but require it to be a geographic, deposit and cultural fit. They’ve paid anywhere from good (0.17x earnings assets) to bad (0.3x+ earnings assets) prices for acquisitions, so the record is mixed. From earnings calls, I don’t think it’s core to the current management team’s strategy — this is not a rollup strategy like Prosperity. I think the risk is less doing a devastatingly bad acquisition and more the returns from acquisition are not going to be as good as organic growth. I’m confident management is aligned with that sentiment.
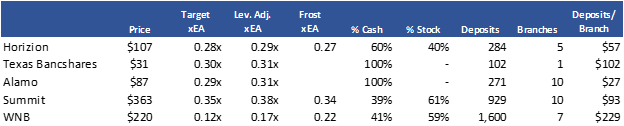
Valuation
Frost earned $5.17 per share 2020. The new accounting standard, CLEC, skews things since it shifted the reserve methodology from probable to expected (i.e., from now until end of loan), which increased the reserves and flowed through to the P&L. I normalized for this by using the historical charge-off rate of 0.3%. I also back out PPP loans from earnings assets and increase the tax rate to 28%. This gets to $5.66/share. Using historical pre-tax ROA (x) Earning Assets, I get $5.0/share. So Frost is trading at about 20x earnings, which is not optically cheap.
If interest rates remain 0% forever, I think it’s realistic to expect 2.5% dividend yield + 6-8% growth for a high single digit return if held indefinitely, which is far higher than what I expect the market to do over 10-15 years. Put another way, if you believe interest rates will be zero forever, Frost is fairly priced.
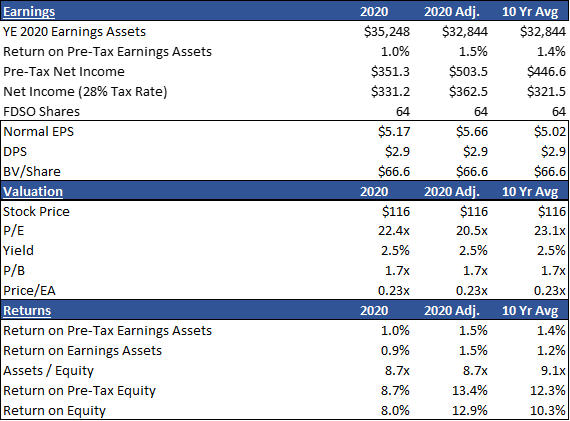
But I don’t expect interest rates to stay zero forever. I have no idea when the FFR gets above 3.0%, but I’m confident it will. So the question is really only how sensitive is Frost to rates and how long can I personally wait?
For my estimate of normal earnings power, I used the same assumptions on liability cost as they funding section. I then layer in a number of assumptions I consider conservative: a 0.5% charge-off rate (historical + 20bps buffer), 1.4% opex (will be lower in the future as cash burn from branch expansions cease), and a 28% tax rate (assuming it increases). I get $10/share in earnings power if everything was “normal” today. That implies 11x normalized P/E. This will obviously take a number of years, but that’s too low for a company that I consider very safe. 20x is a reasonable multiple.
Using some dummy IRR math of 6% deposit growth, rates staying zero for ten years and a 15x terminal P/E, I get a mid-teens return. Again, this is all while risking the growth rate, tax rate, credit loss and operating leverage fairly conservatively. It also assumes commercial demand deposits pay more than what management thinks will happen. Any one of those things could prove too conservative, including and especially when rates rise.
So I feel good about this stock as a buy and hold candidate. Why does the opportunity exist? Because it’s hard to underwrite a stock for institutional money when the catalyst is: Idk it’ll happen someday, probably, more than likely. I don’t know how I would even pitch this to a PM without specifically delineating a view on interest rates. But if you’re taking a macro view, you don’t want this bank. There are better ways to express that view by picking the marginal player. Frost is a weird blend of blah in zero rates and really good in normal rates, which is why I like it as a hedge on rising interest rates as a guy not smart enough to have a view on interest rates.
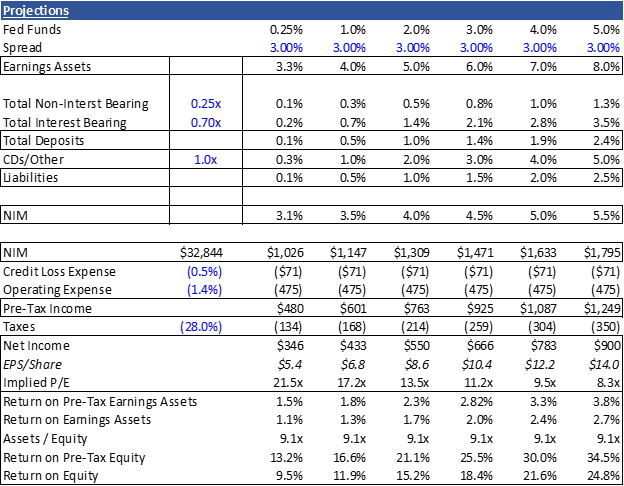
I know almost nothing about Banks, so for the past couple of weeks I’ve spent time on analyzing community/regional banks to get up to speed. I’ve looked at CFR, PB, BOKF, BOH and TYBT so far and will post generally raw thoughts on a few I like.
“When conditions are normal (not boom, just normal), with our efficiency and the quality of our assets, we are going to hit it out of the park”.
Jeff Harp said that in 2012 and unfortunately conditions never did normalize. Despite this, Trinity can earn above average returns on equity even in low interest rate environments by focusing on keeping costs as low as possible even as it runs lower leverage ratios than competitors and has a more liquid balance sheet.
Balance Sheet
Lending
Trinity has averaged ~60% loan to deposits since inception, investing the remainder in mostly Texas Munis. In 2016, Harp said he avoids higher LTD ratios to avoid the negative impacts: reducing lending activity when customers need it, paying above average rates on deposits to reduce churn, and/or financing loans with higher cost funding. My read is this is one part focus on the customer and having the capacity to lend in tight credit markets, partially an inability to find acceptable loans (which I’ll talk about in growth section), and partially a conservative outlook of wanting a highly liquid balance sheet.
Trinity is a business bank. Most deposits are >$250k which it recycles to local SMBs. The book consists of C&I loans (~55%) CRE (~17%), Residential (~15%) and construction/consumer (~6%). This makes it more in line with CFR than PB. Its CRE lending is less risky than most banks as 63% is owner occupied.
Trinity is a conservative lender with 0.34% average charge-offs since inception. 2008-2010 is a good test of how conservative a bank’s lending has been, and Trinity’s was very good relative to peers. Trinity performed about in line with Prosperity Bancshares, a bank heavily in DFW and generally very conservative, at 0.31%.
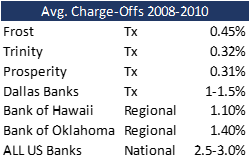
The loan book isn’t overly long with 66% of loans below a 3 year maturity and 92% below 5 years. This will help as interest rates begin to rise and the book can re-price quickly. The securities portfolio is longer but difficult to tell the exact duration – from things I’ve seen in the annual letters, I don’t think they’re going too far off in maturity. The call report says 73% 5-15 years for securities, but I suspect that is weighted to the lower end. This will cause MTM losses as rates rise, but it should not affect the liquidity of the bank.
Assets to Equity has averaged 8.4x since inception (9.2x today). Harp includes an interesting comparison in the Q2 2018 investor letter, that benchmarks ROE vs. leverage for competitors. Despite having lower leverage ratios than virtually any other bank, it still earns above average returns – seen in his Optimization score (ROE x Total Capital).
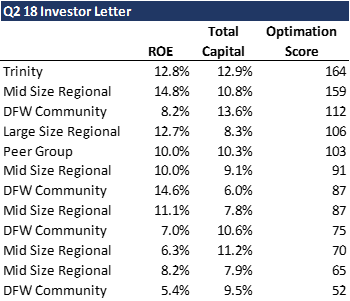
Funding
The liability side of the balance sheet has a lot to like. Deposits as a percentage of assets have average 90%, better than CFR and BOH (~82%), which are two very low cost banks.
Interest Bearing demand deposits are 60% of liabilities, CDs 13.7%, and non-interest bearing deposits 41.5%. Non-interest deposits have increased over time, growing from ~20% in 2004-2013 to 41.5% today. This is comparable to CFR (44%). The intrinsic value of Trinity has thus increased dramatically in the last ten years which is partially obscured by low interest rates. These are transaction and MM accounts for businesses and individual that tend to be very sticky. When/If rates rise, these will have to be re-priced higher but not nearly as much as if they were funding with hotter money like CDs.
On the interest-bearing deposits, Harp says this in 2016 “Our philosophy has always been to pay as much as we can rather than what we can get away with. We are typically not the highest payer but we also take a different approach to managing our liquidity and loan to deposit ratio”. I think this can be read in as a combination of two factors: 1) Harp truly is manically focused on the customer and he sees this as his duty as a relationship banker but more likely that 2) this is a necessary move to keep churn reasonable. Either way, I have a general feeling that if you’re looking for a truly interest rate sensitive bank, CFR is really the way to go.
Efficiency
“Trinity was founded on internal growth but with an emphasis on profitability and efficiency, not size or number of branches” – Jeff Harp 2012
Trinity is an incredibly efficient bank. It has $295M in deposits at a single location. This is higher than CFR ($224M/branch) and BOH ($260M/branch), two of the highest deposit per branch locations in the country. In Tarrant county in 2020, the average bank has $122M per branch across 425 branches. Prosperity bank is just a good as lender as Trinity but no where near the branch level economics (~$100M/branch).
Occupancy cost has trended from .41% of earnings assets in 2004 to .14% today, and this is after over doubling the size of the branch via an expansion in 2016. This number will continue to trend downward as deposits grow.
For the first 9 years of Trinity’s existence, it operated with only 14 FTEs, which basically included only two loan officers (Harp and Barney Wiley) and 12 support staff. Today they have 23 employees total after adding ~5 loan officers and additional support staff. Trinity has ~$14M of earnings assets per employee. The average US bank has something closer to $3M. That said, Trinity pays $165k per employee, well above peers; Harp runs on a shoestring budget, but he still pays above market. Before this expansion, Comp as a % of earnings assets was ~0.93% and today it is 1.16%. I suspect this ratio to come down from positive operating leverage. Getting back to historical levels would be a 0.23% increase in earnings assets, or 1.6% additional ROE with 9x leverage and 25% tax rate.
Director fees are $135k and other expenses $1.5M. Opex as a % of assets is 1.7% versus 2.6% and 2.9% at BOH and CFR, respectively. Those banks, however, can offset this with services that Trinity does not provide. Operating at low expense levels allows Trinity to have above average ROEs even at low rates. Low costs and cheap funding is the source of Trinity’s moat.
Growth
Trinity has grown deposits at 11.2% since inception vs. 9.2% at CFR. For the last five years it has grown 5.0% vs. 2.7%. I get the indication that churn is very low from a combination of paying competitive rates and an emphasis on customer service. This I think has be the case as deposit market share was .57% of Tarrant county in 2010 and 0.60% in 2020. The majority of the growth seems to have come from customer expansion and general economic growth.
Trinity has a tailwind by being located in Tarrant county whose population grew 2.3% in the 2000s and 1.7% in 2010s compared to 0.9% for the US as a whole. I’ve seen some forecasts for Texas at 1.7% for the coming decade, which assuming GDP/person is similar to the Us at ~1.0% and 2-3% inflation, there’s no reason Trinity should grow slower than 5-6% per year. Assuming no market share growth — which I think is fair given no marketing and no branch additions — that seems like a reasonable floor on growth. At the high end, maybe they can achieve market share gains and that bumps up to 6-8%, but 5-6% seems conservative.
The real limit to growth is lending capacity. Lending has been dominated by Harp and Wiley (who built a $70M loan portfolio). They’ve added additional loan officers, but I think they’ve had mixed results. Looking on linkedin, one of their loan officers only lasted a year and the other 3 years. Their ability to retain loan officers and make similar quality loans is the big question for me. New loans per person were $4.7M in 2013 – 2016 versus $2.2M in 2017-2019. Unlike other large banks that can standardize training programs, Trinity has to rely on hiring proven officers from competitors. Combine this with SMB’s smaller overall loan size, and developing new relationships that have a meaningful impact could be a problem going forward. With that said, by keeping loan to deposit ratio at 50%, this isn’t as much as a problem as it would be for other banks.
Management
Jeff Harp is an excellent operator. Reading his letters back from inception he is constantly quoting Buffett and extremely shareholder focused. His thoughts on capital allocation are everything you would want in a CEO. He acknowledges dividends are suboptimal from a tax perspective, but notes they beat making acquisitions just to grow. While he pays lip service to acquisitions if it makes sense, he’s very clear he’s not going to grow for the sake of it. Every letter starts with an MVA/EVA analysis, and it’s clear from these opening discussions he understands capital has a cost and growth is not always valuable. Historically Trinity has returned 37% through a combination of dividends and buybacks. This may have to rise if they are unable to find appropriate loans but I suspect 40% is still the right number for the foreseeable future.
If I knew Harp had another 10-20 years at the helm, I would definitely invest in this company, but unfortunately, he’s in his seventies now and stepped back to be the chairman of the board a few years ago. The person taking over is Matt Opitz, who has only been with the company for 3 years but was VP at Frost for 7 years prior. I think this was smart as Harp was always very focused on new lending and needed to be replaced with someone with a similar background versus a pure management/operating person. Looking into his background he seems fine, growing up in DFW and similar background to Harp, but time will tell. Barney Wiley will be President and is only 45. He’s been with the company since the start and is excellent lender, creating a 70M loan book from scratch. This continuity is nice to have.
With Harp as Chairman, I don’t think anything is going to change drastically in the medium term. I don’t fear any massive push in growth through acquisition or new branch openings. I just don’t think culture as cemented as this in a small organization can change more than gradually. Ten years from now I’d be more worried, but it’s a risk I think I can live with.
Valuation
Trinity has never been valued cheaply in the last ten years. I think investors rightly understand that this is a business that creates value and should be valued at a premium to book. It takes less risk in lending and leverage, has high returns on capital employed and can grow at 5-7% for a very, very long time just from being located in a higher growth state.
I think the simplest way to approach this is to take the current earnings assets multiplied by the historical Return on Pre-Tax assets for the last ten years and then use a 28% tax rate (assuming they are raised). This has been an incredible low rate period, so this is basically saying what is the valuation if interest rates stay 0-1% forever. You get to ~13-15x earnings and 1.6x book, which I don’t think is a stretch for a bank of this quality. At a 7.0% earnings yield and 40% POR, you get a 3.0% cash yield + 6% growth for ~9.0% return if held indefinitely. It looks fairly priced in this enviornment.

The other question is how much can earnings rise with higher interest rates. This is the piece I’m way less comfortable taking a hard view on, but I’ll take a stab. My assumptions are a 3.0% fed funds rate, and a 3.5% spread over FFR on loans/securities (historical average).
I’ve seen elsewhere on some of Geoff Gannon’s Singular Diligence reports that checking/MM accounts tend to be 0.75x the Fed Feds Rate on average, but I can’t source that. Am I misevaluating how sticky these deposits really are? Are SMBs way more sensitive to interest rates than larger organizations?
Looking historically, Trinity has re-priced checking accounts very slowly. In 2010/2011, for example, they were still paying ~0.8% while the Fed Funds was 0.14%. Looking at BOKF (0.5%) and BOH/CFR (0.3%), which seems abnormal. It’s possible that they are not in the competitive position that a Frost bank is in this regard.
For Credit loss I’ve taken 0.3% historical average and added 20bps to account for the fact that Texas was not hit as hard by the last recession and hasn’t been truly tested in 20+ years. Operating expense I’ve kept at historical average, but I think this is conservative as it will go down as they gain scale from the compensation expense they recently added.
This spits out $7.3 EPS at a 3% Fed Funds Rate. At a 15x P/E, this is ~$109/share. At the current price of $65 price that’s +11% to the IRR over 5 years and +5% over ten years (I.e., (109/65)^.10-1) on top of whatever growth/yield.
I’m not super comfortable with the assumptions here on the re-rate. I’d like to say more directionally that this stock can likely return 7-9% if rates never rise, and if they go up earnings be higher that return goes 10+%. I think they can do this with below average leverage, a highly liquid balance sheet and conservative lending. I think this is less risky than the average company, more cheaply valued and will return more than what I’m seeing in general stocks. It would necessitate holding for at least five years minimum.


Disclosure: no position but considering buying alongside CFR. I need to think more about how the deposits re-price, which is gnawing at me
Post inspire by Alpha Vulture Here. At the end of 2019, the company announced a strategic review and ultimately decided to cease making investments and monetize it’s existing assets. They’ve done a series of transactions this year, including spinning off LENSAR, Evofem, and sold off some of it’s royalty portfolio. The company will file a certificate of dissolution with Delaware State on 1/4/2021 after which the stock will cease to trade (including OTC). It will wind down the remainder of the company over the next 2-4 years.
The company published a balance sheet on a liquidation basis recently (cash proceeds, net of projected cost to sell). This is roughly what you’re getting:
Liabilities are relatively straight forward and I burdened with another 10M of misc. expenses. The “uncertain tax position” is the only question mark. The company settled an IRS audit for the tax year 2016 and currently has an audit from the California Franchise Tax Board for 2009-2015 which they are accruing for. There a could be a surprise to the upside here, but who knows.
So adding this all up I’m paying $2.38/share versus $3.25 of distributions (adjusted for options and small reserve for other expenses) for a total of 1.36x MOIC . Thinking in MOIC terms only, a lot has to be wrong for you to lose money here. The thesis really hinges on what you believe about royalty assets and the Wellstat note. If they sell (or prices drop) by 25% for royalties and the Note Receivable is a zero , then you break even, which feels like a healthy margin of saftey.
On an IRR basis timing obviously matters. This will take at least through 2023 based on Evofem payments. Below I’ve laid out a rough estimate on distributions. This is on a distribution basis rather than the actual cash inflows/outflows (my understanding is they won’t make distributions for at least 12-18 months based on safe harbor provisions). At the end of the day this is not much more scientific than MOIC^(1/n)-1,but timing is important enough to be precise. I get ~17% IRR. I think this is likely to be conservative; Management has no incentive to do anything other than sandbag this range. The uncertain tax provisions if added back get’s you another 400bps.
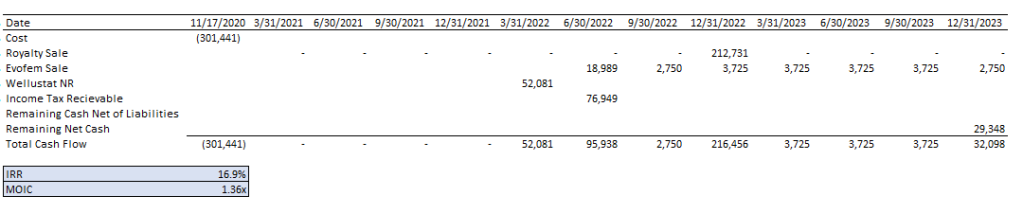
Thinking through a few scenarios (same timing as above), I still think it’s generally attractive returns to the downside. For a 10% cost of capital, You need to believe there is a ~70% chance of case #2 where the notes are 60 cents on the dollar and the royalties at 80 cents on the dollar to miss the benchmark. That feels excessive. The disaster scenario just feels draconian and even then it’s just dead money.

Framing this another way, there is a collection of uncorrelated assets that each have a different risk profile. Cash and AR = no risk. Asset sale and income tax refund, I don’t think risky so 3% for some time value. Note receivable some clear credit risk so let’s say 12%. Royalty assets I think (?) trade at 15%-20% unlevered, so let’s make it 20% to be safe. Weighted by assets, you need ~11% for this to be correctly priced. The IRR I’ve laid out is ~17%. That feels decent relative to the risk. I could get cute and add an illiquidy premium of 600bps, but I don’t work for Houlihan Lokey valuing portfolios so I’ll refrain.
So risking capital for 17-20% return that’s difficult to lose money feels like a good bet. This is one of those turn your brain off, and be ok with 70% of the knowledge necessary rather than trying to diligence it to the basis point.
One of the other reasons I like this is it’s relatively insulated from the overall market. The Luby’s liquidation is attractive on an upside basis (or was) but they have no access to capital if something goes wrong. If you think their assets are undervalued, you could be right, but a 08-09 freeze up probably cause a serious impairment of capital (they have no access to capital anyway). With PDLI, it’s a self-contained little box. No one wants to buy the royalties? That’s fine, we’ll just distribute the distributions (I doubt diabetes is cyclical…). Credit freezes up? That’s fine there is plenty of cash to fund liabilities.
Conclusion: Long at $2.38/share
